The academic year is winding down for many school libraries. Staff have been busy providing programs and services that support their institution’s students and faculty and aid in their success, including maintaining a collection that reflects their student body’s needs to providing guidance on research topics and career development. Not only do school libraries provide a high level of learning, but they are also inclusive and welcoming places for students to build relationships and form a sense of community.
Once the year is over, trying to convey the impact of your library can feel overwhelming. But it’s important to make certain school administration, students, parents, and your community understand the value your library provides, especially now, with rising book challenges and cuts in funding and staffing at many school libraries.
Make it easy to understand and share your library’s successes and value by creating an infographic.
What is an infographic?
An infographic takes complex text information and uses imagery to tell a story that is quick to read and easy to understand. Infographics can make statistics and outcomes come to life. They are more visually pleasing than a standard report.
Why use an infographic?
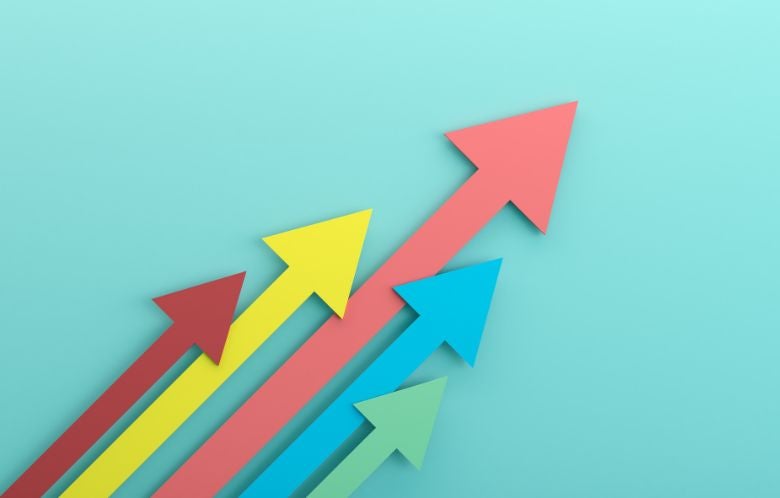
Infographics are an educational and useful tool. Done right, they are also fun and eye-catching. Most importantly, because these short visual snapshots are easily digested, they can be incredibly impactful. According to the Visual Teaching Alliance, the human eye can process images 60,000 faster than it can process text!
If you’re looking for an effective advocacy tool for your library, consider an infographic. They’re an easy way to make sure your institution, board members, and other stakeholders know the impact you have.
5 steps to an effective infographic
As a graphic designer for LibraryAware, these are the steps I follow when designing infographics for our customers. Whether you use one of our templates or start from scratch, here are five steps to follow:
- Create an outline to help you lay out the elements you want to include in your infographic. What are the essential highlights of the year that you want to share? What do you want people to remember most?
- Limit yourself to two fonts for the infographic – one for the title and header and one for the body of the infographic. You can use a more fun or decorative font for your title and header, but keep the body font simple so it’s easy to read and not overwhelming when skimmed at a glance.
- To keep your infographic easy to read and visually appealing, choose no more than three to four colors that work well together. You can use your school’s colors, or you can create a new color palette. LibraryAware templates use professionally chosen color combinations that meet accessibility guidelines. Or you can search online for free color palettes to help you choose your own.
- Keep it clean and simple. Your goal is to communicate a lot of data in a simple, easy-to-understand way. Leave plenty of space between each statistic and use minimal text. Your infographic should primarily use graphics and visual elements to communicate your data.
- Create an easy-to-follow layout. Organize your infographic in a way that flows and tells a visual story. The most essential information should be prominent, at the top, and typically read or viewed from left to right.
Lastly, don’t forget to add your school’s logo or mascot to the template and include your website URL!
How LibraryAware can help you share your story
LibraryAware offers a unique infographic design created specifically for school libraries. We also have a wide range of designs for year-round use. Just type infographic into the LibraryAware homepage search bar to find them.
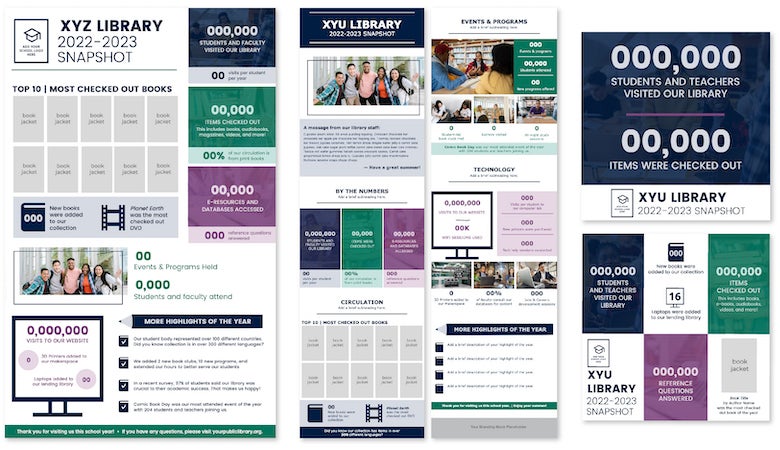
Templates #MadeinLibraryAware.
After you have created your infographic, share it with as many people as possible! LibraryAware has created graphics that highlight each section of the infographic that can be easily posted to your website and social media in short snippets.
A great way to share your success is to send out an infographic e-blast. This is an easy way to reach your audience and show them how important you are to your institution’s students and faculty.
Denise Turner is a Senior Graphic Designer for NoveList. She is currently reading Invisible Girl by Lisa Jewell.