To understand what a concept map is and how it can be leveraged in research and information literacy skills. it is important to look at its origins. Joseph D. Novak of Cornell University is a pioneer of the Concept Map and has written books and articles around the idea of “Learning How to Learn,” (also the title of one of his published books). Novak and his team developed the technique of concept mapping to connect subjects of emerging science for students. A concept map is a great example of the learning movement, constructivism — essentially the school of thought that a learner can actively construct knowledge. Novak used Concept Maps as a way for educators to test a learner’s knowledge before and after the education of that topic/subject.
Why are the origins of a concept map important to libraries and their users?
Over the last few years (or more), libraries have been tasked with building information literacy skills in students. In fact, it has become such an important cause that library organizations such as the ACRL have developed a framework around information literacy. Information literacy is not just important for the library and usage of the library, but for the academic institution. It’s proven that students who utilize the library for research tend to have better GPAs. Not surprisingly, information literacy and constructivism share similar principles when it comes to acquiring and exercising research knowledge.
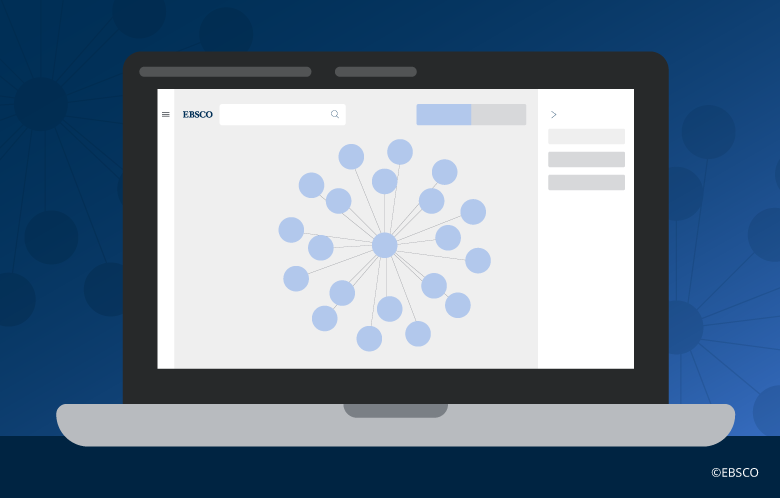
Second, is the idea around the visualization of information. In fact, studies have shown that humans process images 60,000 times faster than text. A concept map combines the idea of “constructing knowledge” along with a visual representation of related topics — helping library users to establish connections in their research and essentially learning to learn on their own. For example, a search for “Italy” provides an image of Italy with multiple spokes extending from it, each representing an Italy-related concept, such as “Rome,” “Alps,” or “Papal States.” These spokes suggest additional subjects to the user, and they can relaunch their search with an improved query. This “connect-the-dots” approach facilitates better information literacy, as it helps users hone their searches.
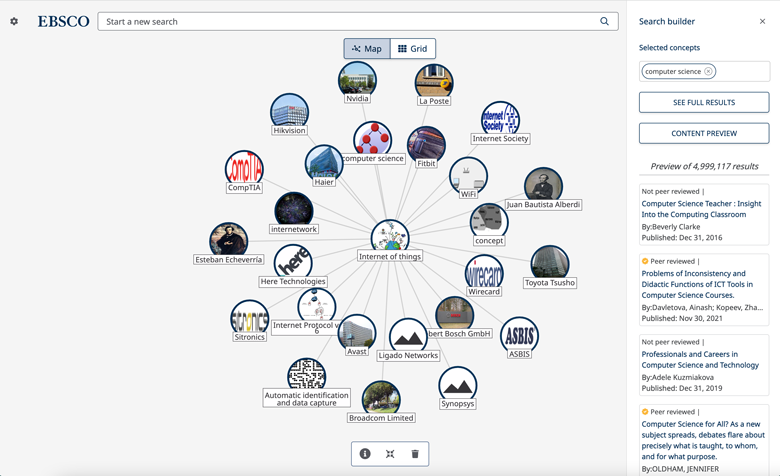
The “brain” behind the Concept Map in EBSCO Discovery Service is a Knowledge Graph. A knowledge graph is a semantic network of related things, and the concept map is the visualization of this network. Thanks to the Knowledge Graph, library users can access expert information even if they are not expert researchers. The Knowledge Graph maps new datasets that incorporate natural language, extensive subject vocabulary and a vast array of synonyms and concepts in more than 280 languages and dialects. This is beneficial across multiple dimensions as it not only enables users to build connections in their research via the concept map but also enter search terms in their native languages.
The EBSCO User Research and Product Management teams worked closely with customers and library users to develop the Concept Map feature in EBSCO Discovery Service. As part of continuous improvement to provide customers with the best possible user experience, we added a variety of enhancements to Concept Map:
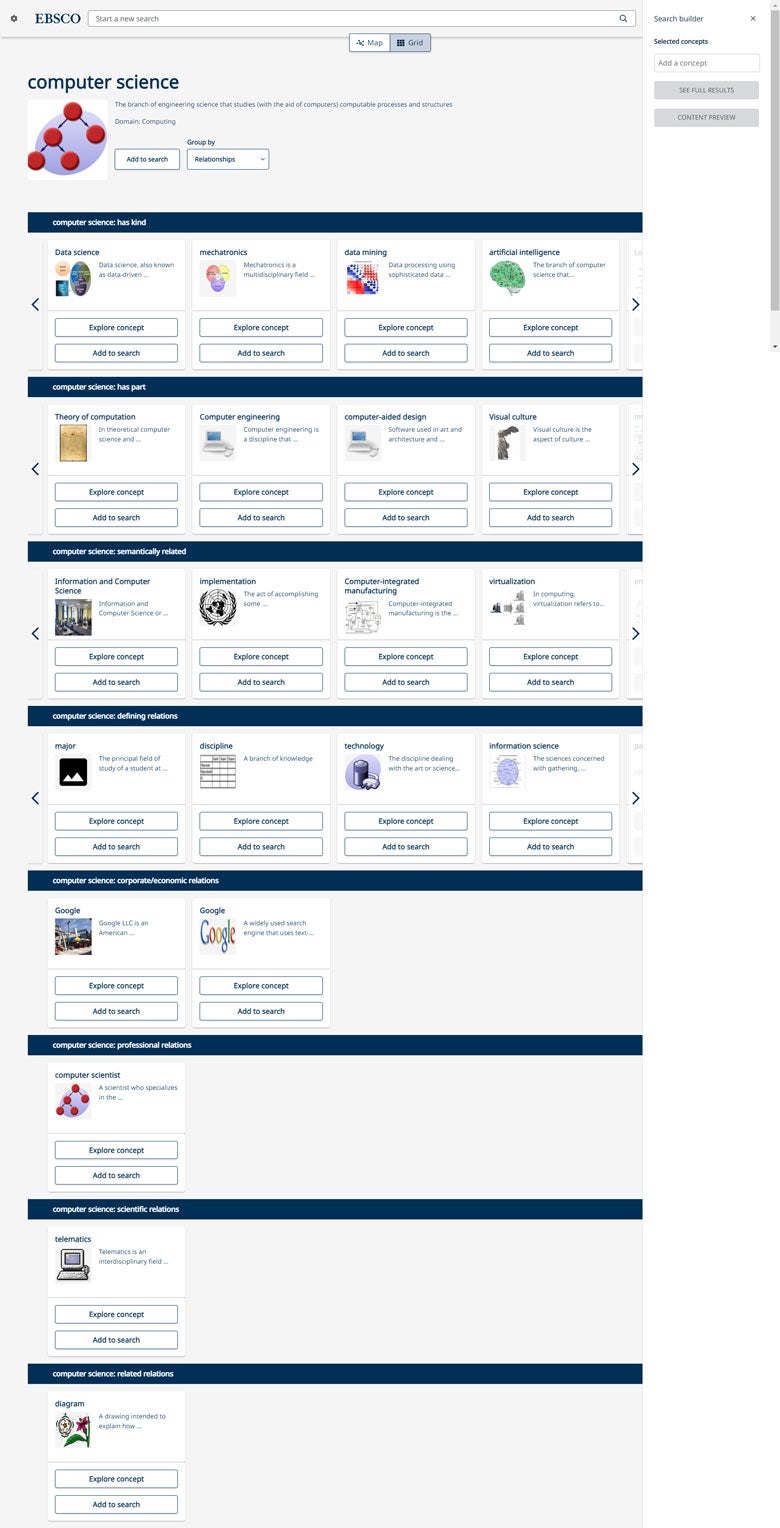
- A new Grid View provides improved accessibility for Concept Map and is an alternate way for users to view Concept Map data.
- Based on customer feedback, we have revised the type of the relationship to be more prominent. In addition, the new Grid View offers a grouping of related concepts by Domain.
- An updated color palette for improved accessibility and usability.
To learn more about the Concept Map in EBSCO Discovery Service, watch the video below, or click the link to view the detailed page in EBSCO Connect.