Many libraries face the stress of reporting required information to the government or library associations when it comes to library data. And yet, the goal of many of these organizations aim to ensure that information about higher education is available for policymakers, students, and parents. In fact, since the early nineties, any postsecondary institution within the United States that participates in Title IV financial aid is legally obligated to provide data. Making key decisions about resource allocation requires this kind of data, but the amount of effort that goes into reporting is a significant hurdle for many academic libraries. With a data submission deadline occurring yearly and data requirements evolving year over year, many academic libraries are looking for a better answer to the process.
The average academic library uses at least six different systems to manage its collection, resources, usage and access to library resources (e.g., ILS, ILL, Discovery, COUNTER, Authentication System, Gate Count). While these systems integrate and work together for the end-user, on the administrative side, these systems and data are quite disparate, which means pulling and gathering data becomes time-consuming. A 2021 survey conducted by Library Journal and EBSCO shows that the barrier to data analysis at their institution is a lack of time (61 percent). Streamlining data and simplifying the process of gathering data not just aids in IPEDS reporting but allows library staff to save time and focus on larger initiatives for the library.
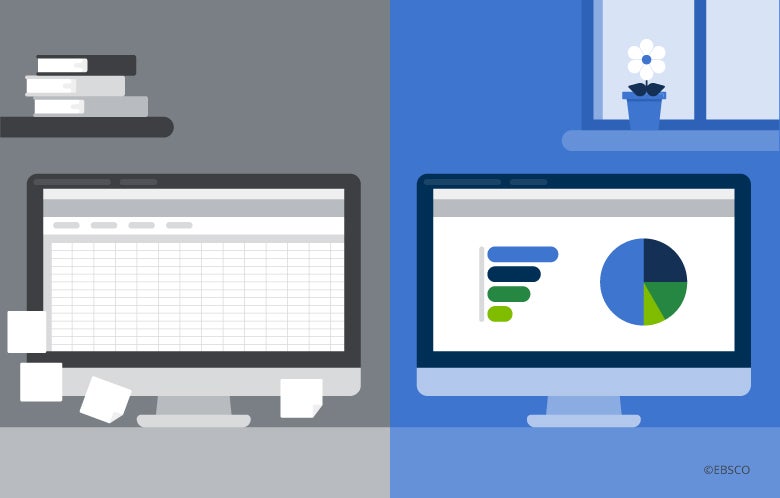
More than half of college and research libraries have seen a reduction in areas of their budget. With a strong need to demonstrate the importance of the library and the need for more funding, Data reporting can shed light on this– not just to government entities but to the academic institution as well. Yet, many academic libraries still rely on manual processes for gathering and analyzing data (think Excel). Not only do manual processes take up time, but they are also nearly impossible to scale and pose a risk of error and security issues. Leveraging an automated process for reporting allows librarians time back but also better insight into library processes, removes potential errors, and keeps data and user privacy secure.
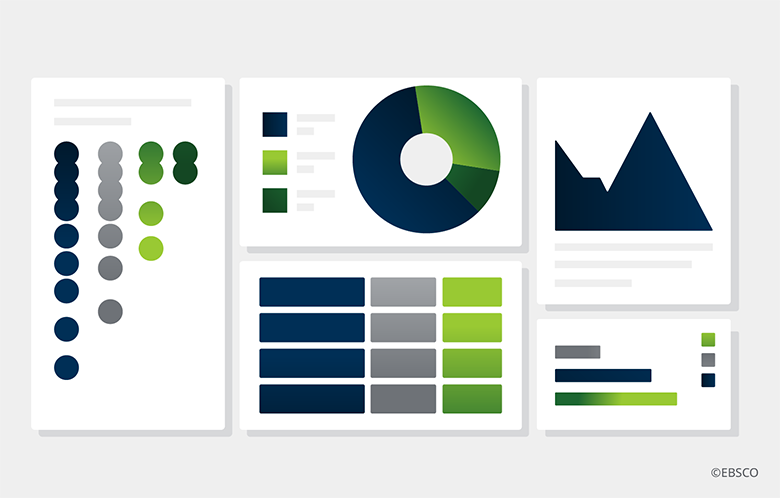
The easiest way to identify missing or incomplete data is to have it organized and displayed in a digestible way. Simplifying the presentation of library data and visualizing it in a graphical way that is easier to analyze allows library staff to relax into an investigative mindset rather than a perfunctory mindset. It allows questions to arise and missing data to be uncovered.
Improving national reporting standards for libraries and data accuracy is a goal of the product development team for Panorama.
Improving national reporting standards for libraries and data accuracy is a goal of the product development team for Panorama.
Panorama’s dashboards help libraries gather the data needed for reporting to national standards organizations, such as ACRL, ARL, and IPEDs. Making these kinds of reports easier for libraries and improving data accuracy was a goal of the product development team for Panorama. Libraries can now streamline the below data sources into a single dashboard to easily view, download and send to their respective organizations.
- Library circulation
- Library physical collection
- Expenses
- Interlibrary loan services
- Library staff
- Branch and independent libraries
- Operations and maintenance expenses
And reporting is not just for single university libraries. Library consortiums (small and large) like SCELC are leveraging Panorama to enable national reporting standards. Read the details in the joint press release.