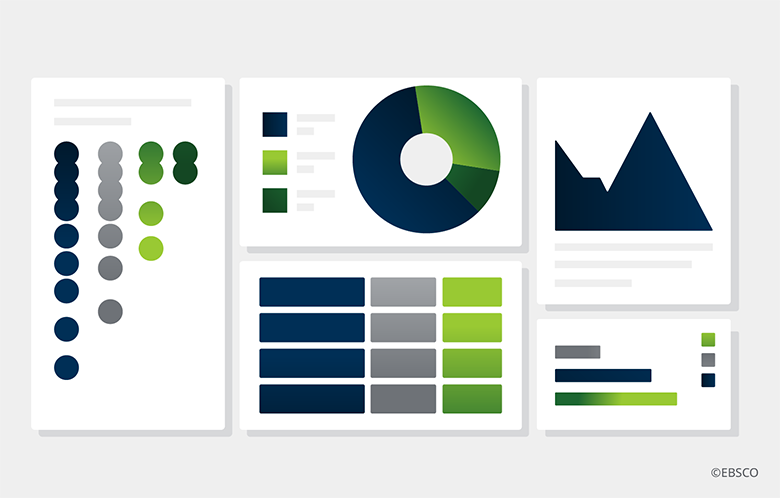
Librarians of all focuses need a holistic view of the library’s collections, services, and operations. Enter transformative data. More than just a set of numbers or an indication of usage, transformative data tells a story through the layering of various attributes. This approach benefits the diverse needs of the entire library staff – from collection development to the director. While connection and correlation are at the heart of transformative data, the struggle to create this kind of approach to analytics is rooted in manual processes and disparate sources or requisite tools that require specific expertise.
This roundtable discussion provided insight into how librarians took a new approach to library data management, leveraging Panorama, a next-gen library analytics platform. The panel also discussed when they were able to create a transformative data approach and why it is imperative for effective decision-making. Here are three key takeaways from the session:
#1 Align with the Provost
For Rachel Besara, Associate Dean of Libraries for Missouri State, a meeting with the new Provost was an opportunity for the library management team to demonstrate the performance of the library. The conversation centered on KPIs (key performance indicators) for which the provost wanted to better understand and see the data. The work that the team had done over the years, combined with leveraging Panorama, allowed them to create a visual dashboard of the established KPIs that the provost was interested in. This demonstrated to the provost that the library is in tune with what is being asked of them, can refine its KPIs to meet the objectives and goals of the provost, and what data is needed for the provost to better understand how the library serves its function to the academic mission.
This demonstrated to the provost that the library is in tune with what is being asked of them, can refine its KPIs to meet the objectives and goals of the provost, and what data is needed for the provost to better understand how the library serves its function to the academic mission.
This demonstrated to the provost that the library is in tune with what is being asked of them, can refine its KPIs to meet the objectives and goals of the provost, and what data is needed for the provost to better understand how the library serves its function to the academic mission.
#2 Improving the Day-to-Day of Students
One of the important things about transformative data is its ability to tell a story rather than be a set of data points. It is this ability that helps librarians uncover trends and correlate disparate data points to improve the day-to-day of students. For example, IT Librarian Shelton Richardson noted that he was able to correlate desktop and library-loaned laptop usage data (via LabStats) with an increase in the usage of electronic resources. This was a big pain point for the library – layering data points that traditionally are not located on the same platform. This helped Richardson better understand how many physical computers were needed to better serve students. The result? Doubling laptop quantities.
#3 Visualize your Collections
Optimizing your library’s collection is key not only to usage but also to the budget. Jinong Sun, Acquisitions and Collection Development Librarian, noted that streamlining collection data into a visual dashboard has allowed her not only to identify top publishers but also to see the top requested journals. This has helped to make better evidence-based decisions around collection development.