Our world is more visual than ever before. Every day we encounter new information, much of it presented in charts, graphs and diagrams. Per the American Association of School Librarians (AASL) Standards for the 21st Century Learner, an information literate student must be able to interpret and think critically about information presented in a variety of formats, including visual media. In addition, students must use visual literacy to “create products that express new understandings.”
Infographics have become a popular form of visual media. They combine images, text and data to visually communicate a message, educate people about a subject or explain a problem or solution. Typically, infographics are easy to read and easy to understand. School librarians and other educators can use infographics as both instructional supports and assessment tools. In addition, infographics provide an engaging way to promote the use of school library resources.
Using Infographics in Instruction
Since our brains process the images we see much faster than the text we read, supplementing instruction with visuals is an effective strategy. Educators argue that students learn best when presented with information in multiple formats, so using infographics can make your teaching materials more accessible to all learners. To start, you could include infographics in your class syllabus, handouts, slide presentations and test review.
Infographics can also be used to teach students about the research process. “Infographics can be both starting points and culminating experiences for authentic learning,” says Kathy Fredrick (2013). “As students are guided through a research process, infographics can be used as examples of how to approach a topic. They can also be used to foster learning about locating and interpreting information” (p. 24). Help students become more discerning about the information they find on the internet by creating infographics on how to spot fake news, apply the CRAAP test to an internet source, or tell the difference between scholarly and popular resources.
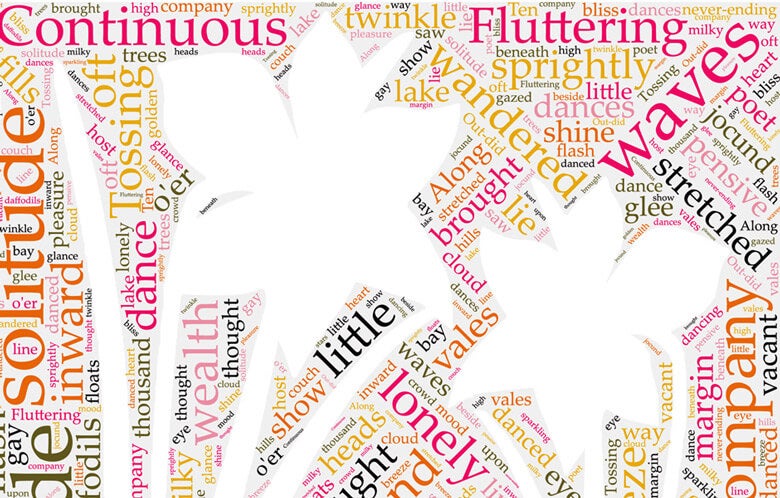
Librarians can help teachers in all curriculum areas to incorporate infographics into their instruction. For example, history teachers can create timelines of important events, math teachers can use infographics to present complex formulas, and science teachers can create infographics to teach processes such as photosynthesis or help students remember lab safety procedures. Finally, English language arts teachers can use infographics to help students recognize literary devices and figurative language. EBSCO’s Literary Reference Center Plus™ and Poetry & Short Story Reference Center™ contain new infographic content ― such as character maps, short story plot maps and poetry word clouds ― to enhance teaching and learning.
“When infographics are used in conjunction with activities that require reading and critical thinking, students develop important, transferable skills” (Lamb and Johnson, 2014, p. 65).
Using Infographics in Assessment
AASL’s Standards for the 21st Century Learner ― as well as the Common Core State Standards and other state curricula ― ask students to draw on information from a text and conduct research to build and present knowledge. Giving students the option of synthesizing inquiry-based research and presenting their findings in the form of a creative infographic is a great alternative to the traditional writing assignment.
Says Fredrick, “Just as we want students to be able to synthesize what they’ve read into a summary, infographics can be used as visual representations of what has been learned” (p. 24). Jaeger (2012) agrees: “Creating infographics gives students the valuable purpose to read closely ― to be able to deeply understand the material to represent it […] visually” (p. 18).
Using Infographics to Promote School Library Resources
To help students and faculty better understand the value of the school library, you can create a variety of infographics. Show students how to access library databases, conduct Boolean searches or find relevant books using your library’s call numbers. (Here’s a sample infographic of the Dewey Decimal System.)
You can create infographics that communicate statistics about your library, such as the size of your library collection or top books circulated. Infographics can also help students quickly learn your library’s rules and procedures.
Five Fun and Free Tools for Creating Infographics
Canva
With a variety of ready-made templates to get you started, Canva is user-friendly. Once you select your template, simply type keywords into a search box and choose from hundreds of images to include in your infographic design. You can also add backgrounds, shapes, icons, photos, illustrations and text.
Easel.ly
This simple design tool provides free access to thousands of images and infographic templates. The drag-and-drop feature is easy to use, and your completed infographic can be downloaded for printing. AASL named it a 2015 Best Website for Teaching & Learning.
Infogr.am
Students and educators can use this tool to create charts, graphs, maps and other infographics. This tool is best to use if you have your data ready to go. The basic plan limits you to 10 infographics before prompting you to upgrade to the Pro version. Special pricing for educators is available.
Piktochart
Create long-form infographics, bar graphs, pie charts and more with free access to more than 4,000 images and icons. You can download your final masterpiece or share it using the tool’s built-in social sharing options.
Venngage
This easy-to-use infographic maker lets you choose from more than 100 templates. The free plan lets you create only five infographics, but affordable individual and educator plans offering full access to all the tool’s features are available.
References / Suggested Reading (all available via Library & Information Science Source™ from EBSCO):
- Abilock, D. & Williams, C. (2014, November/December). Recipe for an infographic. Knowledge Quest, 43(2), 46-55.
- Evans, R. (2016, July/August). Infographics on the brain. Information Today, 4-8.
- Fredrick, K. (2013, December). Visualize this: Using infographics in school libraries. School Library Monthly (30)3, 24-25.
- Jaeger, P. (2012, August). Is a picture worth $2,500? School Library Journal, 58(8), 17-18.
- Lamb, A. & Johnson, L. (2014). Infographics part 1: Invitations to inquiry. Teacher Librarian, 41(4), 54-58.
- Lamb, A. & Johnson, L. (2014). Infographics part 2: Practical ideas for your school library. Teacher Librarian, 41(5), 64-67.