Alternative Text Format | Download
Earth Month in Numbers
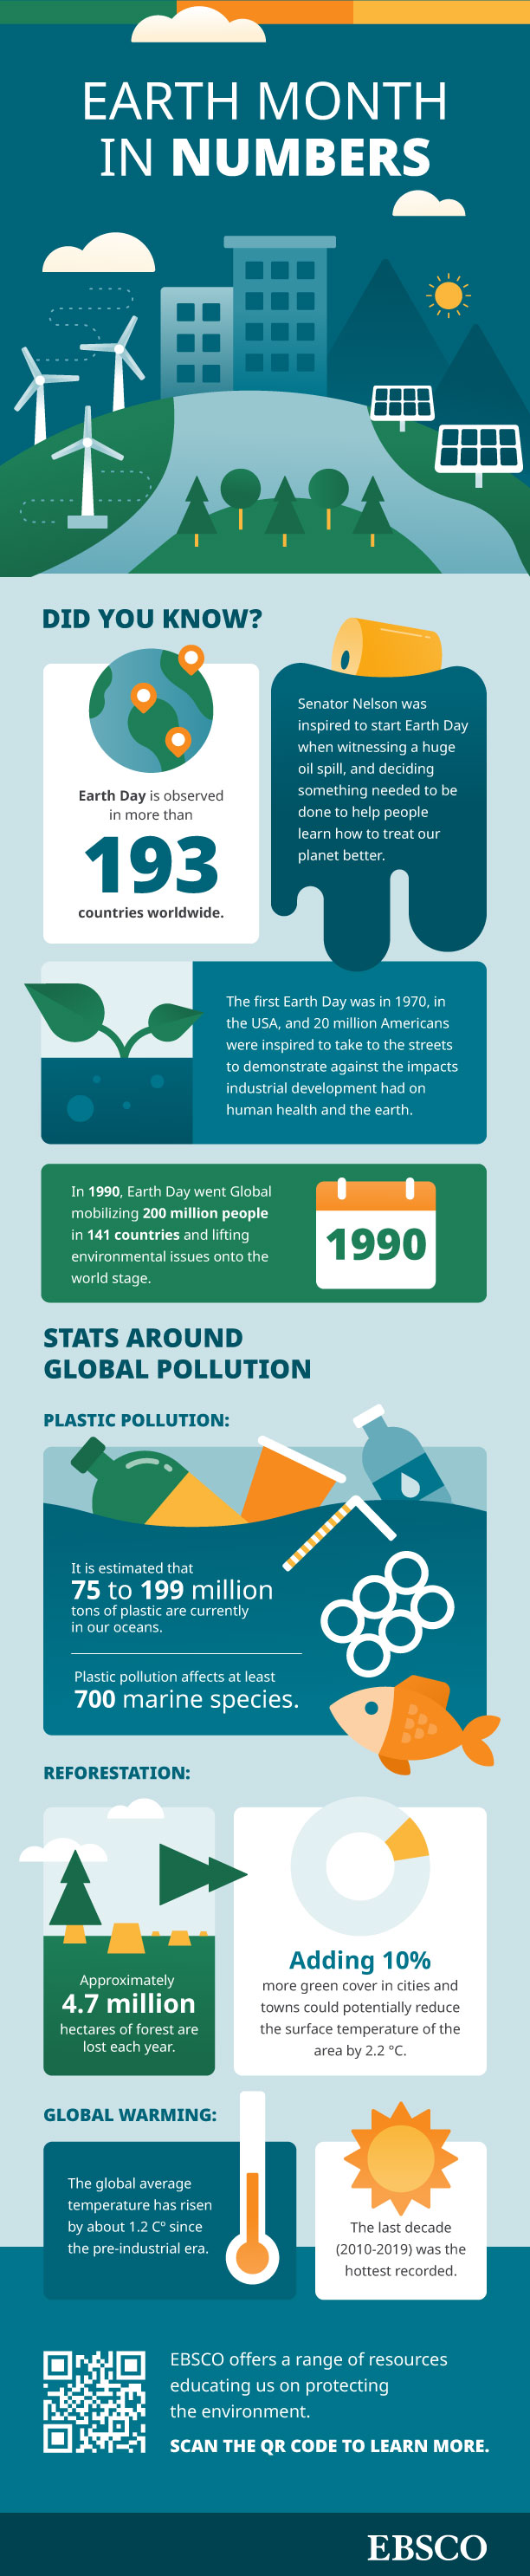
Earth Month in Numbers
Did you know?
Earth Day is observed in more than 193 countries worldwide
Senator Nelson was inspired to start Earth Day when witnessing a huge oil spill, and deciding something needed to be done to help people learn how to treat our planet better.
The first Earth Day was in 1970, in USA, and 20 million Americans were inspired to take to the streets to demonstrate against the impacts industrial development had on human health and the earth.
In 1990, Earth Day went Global mobilizing 200 million people in 141 countries and lifting environmental issues onto the world stage.
Stats Around Global Pollution
Plastic Pollution:
- It is estimated that 75 to 199 million tons of plastic are currently in our oceans.
- Plastic pollution affects at least 700 marine species.
Reforestation:
- Approximately 4.7 million hectares of forest are lost each year.
- Adding 10% more green cover in cities and towns could potentially reduce the surface temperature of the area by 2.2 °C
Global Warming:
- The global average temperature has risen by about 1.2 degrees Celsius since the pre-industrial era.
- The last decade (2010-2019) was the hottest recorded.
EBSCO offers a range of resources educating us on protecting the environment. Learn more.