
Individual Patient Data Meta-Analysis (IPDMA) is a powerful analytic modality that sometimes offers insights that are not possible with aggregate data or trial-level meta-analyses. So, are these analyses the crème de la crème for the question of statins for primary prevention of cardiovascular disease (CVD)? Well, maybe not.
First, the CTT data show the average reduction in LDL-C from taking a statin is about 1 mmol/L. This estimate is restricted to a one-year time horizon and includes trials of primary and secondary prevention. The USPSTF 2022 systematic review and meta-analysis (SRMA) did not report on changes in LDL-C, but a 2013 Cochrane review of statins for primary prevention found a similar reduction of 1 (95% CI, 0.85 to 1.16) mmol/L. Of note, an important trial published in 2016, HOPE-3, reported an average LDL-reduction of about 0.89 mmol/L.
The Cholesterol Treatment Trialists (CTT) analyses model the estimate of CV risk reduction per 1 mmol/L reduction in LDL-C, finding a risk ratio (RR) of 0.75 (95% 0.71 to 0.80) per 1 mmol/L reduction in LDL-C. But how robust might this estimate be beyond 1 mmol/L reduction in LDL-C? Let’s take a closer look at the CTT analyses:
In short, visualizing the data gives a more nuanced perspective. The above RR and 95% CI might seem fairly definitive, but let’s look at the individual trials:
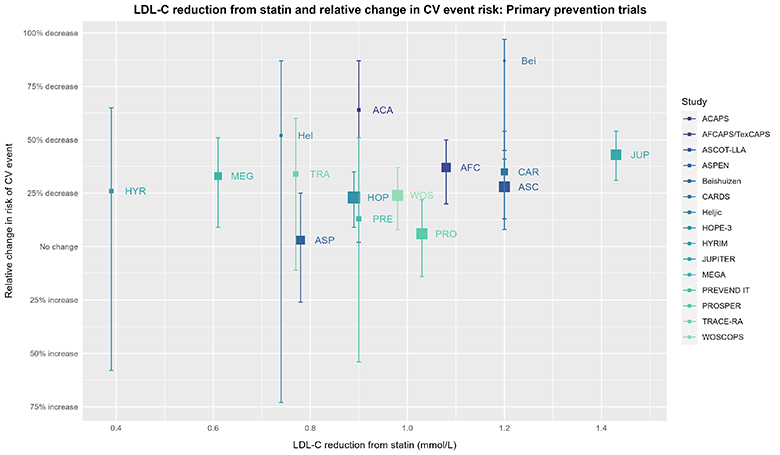
The size of the square for individual trials is proportional to the inverse of the variance of the effect estimate (more precise estimates will have larger squares). Relative effect estimate values for the trials are from the USPSTF SRMA. Corresponding values for reduction in LDL-C (only considered at 1 year in the CTT IPDMA and not considered by the USPSTF SRMA) come from Byrne 2022 and were cross-checked against Silverman 2016. Any discrepancy > 0.01 mmol/L was resolved by consulting the original paper. Values for LDL-C reduction for trials not included in Byrne 2022 or Silverman 2016 (due to inclusion/exclusion criteria) come from either the Cochrane review or consultation of the original paper. Plot made with ggplot2 (3.4.2) in R (4.3.0).
Now, imagine someone asked you if you noticed a pattern in the above data, and if so, what kind. What would your answer be?
To continue our thought experiment, let’s now look at that same plot, but add the estimate from the CTT group. In the visualization that follows, ask yourself the question: How well does the CTT estimate represent the underlying trial data? Phrased differently, you can “draw a line” through any data, but how convincing is the CTT estimate in establishing a dose-response effect? While considering this question, remember what your thoughts were when reviewing the “plain” plot without the CTT estimate shown.
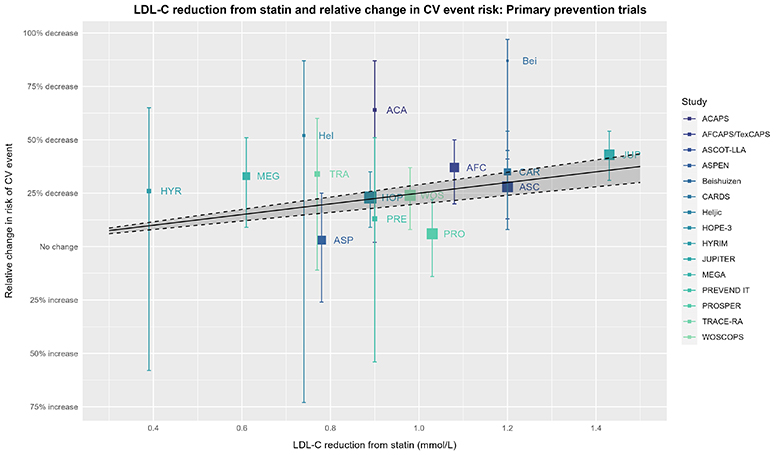
The captions for the prior plot also apply here. The solid line, dashed lines, & shaded area depict the expected effect estimate based on the RR of 0.75 (95% 0.71 to 0.80) = RRR 25% (95% CI 20% to 29%) per 1 mmol/L (≈38.7 mg/dL) decrease in LDL-C from the 2019 CTT IPDMA.
We can continue this thought experiment with exploring LDL-C reduction and relative changes in CV risk further via meta-regression using the trial-level data (with LDL-C reduction as the covariate):
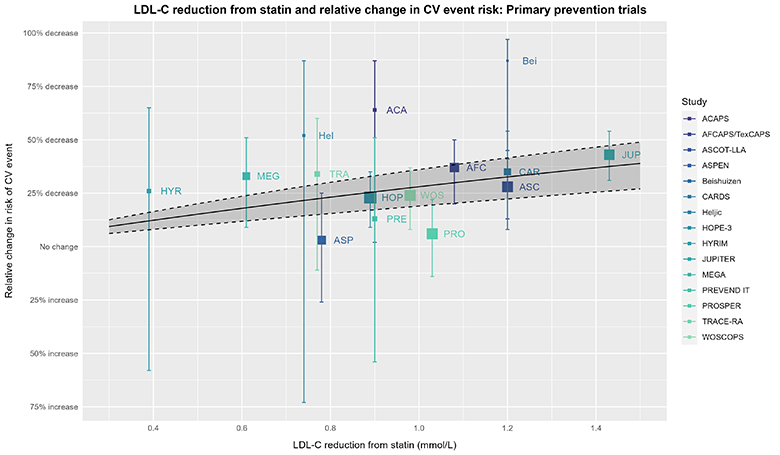
The captions for the prior plot also apply here other than the solid line, dashed line, & shaded area depicting a meta-regression with its 95% CI (using meta [6.2-1] and metafor [4.2-0]) based on trial-level data for the RR and reduction in LDL-C. The wider 95% CI from this analysis is unsurprising given the difference in this analysis vs. the CTT’s IPDMA.
For the statistically inclined, the CTT analysis and above meta-regression of trial-level data force the model intercept through the origin; thus, if LDL-C reduction is zero, so is the reduction in CV risk. In other words, both analyses assume statin efficacy is mediated entirely via LDL-C reduction. This might seem reasonable based on what we know about the role of LDL-C in CV risk and the effect statins have on LDL-C. However, statins have pleiotropic effects independent of LDL-C reduction (e.g., as shown by Davignon 2004, Ray 2005, Ridker 2008, Oesterle 2017), so it may be overly simplistic to assume statin efficacy is mediated entirely by a reduction in LDL-C. Although we do not have the luxury of seeing the CTT analysis without this assumption, we can consider the same meta-regression without forcing the intercept through the origin as a continuation of our thought experiment:
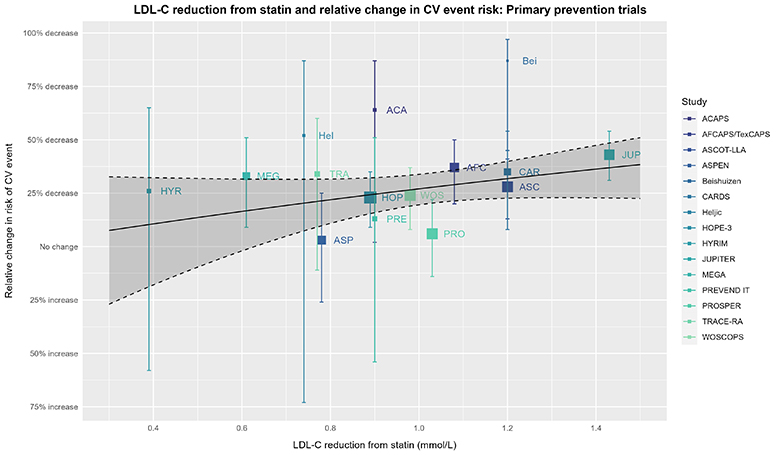
The captions for the prior plot hold here as well.
Considerations in Meta-regression
As “flashy” as these meta-regressions may seem, meta-regression can be inferentially regressive (forgive the pun), so consider the above examples an exploratory (at most) part of our thought experiment. Meta-regressions often suffer from low power, are always observational (Deeks 2019, Riley 2021), and they can be misleading when not carried out and considered carefully.
One critical issue is trying to estimate treatment-covariate interaction at the individual level via meta-regression with a covariate based on data aggregated across studies for a participant-level characteristic that usually varies among people in the same study. This situation is ripe for aggregation bias (sometimes referred to as a type of ecological fallacy/bias). Approaching meta-regression in this manner has even been called “daft” (Fisher 2017, Riley 2021).
The above meta-regressions indeed suffer from this issue. Moreover, rather than the covariate being something that’s identifiable pre-treatment for any given patient, it’s a post-treatment, between-group variable (more on this in a bit).
But did the CTT analysis do the same thing? Well, in a word, yes. Although they have individual patient data, it’s clear they’re using across-study, aggregate data for the difference in LDL-C:
The individual patient data cannot really “help” with the covariate of interest anyway, because the CTT analysis used the difference in LDL-C between treatment and control. A between-group difference, by definition, cannot be assessed for an individual patient, as any given patient can only experience a change in LDL-C from baseline, which necessarily includes the change in LDL-C due to the assigned intervention plus anything and everything else that happens over time (including, for example, lifestyle changes). This is a classic reason why a within-group analysis is so problematic when trying to understand the effects of an intervention (so, it would not have been better if the CTT had used each person’s change from baseline).
So, things are … complicated. The CTT projection for CVD risk reduction is not simply the crème de la crème, especially if there is no intent to incorporate the implications of the CI into clinical decision-making. This is more than nit-picky perfectionism. The considerations thus far introduce questions about modeling CV risk reduction per 1 mmol/L reduction in LDL-C and assuming the effect is entirely mediated by such.
Nothing herein denies the role of LDL-C in the pathophysiology of adverse CV events or excludes the possibility of LDL-C reduction having predictive capacity for CV risk reduction in primary prevention. Nevertheless, LDL-C is a surrogate marker, and many (e.g., Hayward 2012, Hofer 2016, Mayer 2016, Krumholz 2017) have weighed in over the years to keep the focus on patient-relevant outcomes. Krumholz 2017 sums it up nicely:
“Except for extreme phenotypes, the decision is about risk reduction, not cholesterol levels. The evidence-based lipid-lowering drugs seem to lower risk even if a patient’s initial LDL is low; they are risk-reduction medications.”
And there’s more to consider.
What about Intention-to-Treat?
A substantial hurdle in making use of the CTT analyses is their choice to model the effect per 1 mmol/L reduction in LDL-C. That choice breaks intention-to-treat (ITT), because the question is no longer “How much might you benefit in terms of CV risk reduction if I prescribe this statin?” (which is what the trials investigated), but rather, “How much might you benefit in terms of CV risk reduction if you take this statin and it works well enough, your adherence is high enough, etc. that your LDL-C goes down by X amount?”. These are different questions.
For example, it’s not surprising for someone with greater adherence to have a larger LDL-C reduction or fare better in terms of CV risk. Statins work best when they are taken. But compared with people who are less adherent, those who are more adherent tend to have other differences that culminate in a more favorable prognosis. The potential for “adherence proclivity” to be related both to degree of LDL-C reduction and CV risk muddies the waters.
Disregarding this inferential obstacle would be unwise, and even having to caveat patient discussions that the benefits of statins are dependent on achieving a certain degree of reduction in LDL-C introduces considerable complexity. And although there are general expectations of relative reductions in LDL-C for low-, moderate-, and high-intensity statins, these are essentially averages. In sum, the CTT estimate breaks ITT, is dependent on achieving a certain magnitude of LDL-C reduction (when this is not what the trials examined), and assumes the entire effect is mediated via LDL-C reduction. What’s more, superimposing anticipated LDL-C reduction introduces further uncertainty (if nothing else, room for additional random error).
So, one is right to have pause about the degree to which one can use the CTT IPDMAs to estimate the efficacy of statins for primary prevention of CVD, particularly for decision-making at the bedside. What might the USPSTF SRMA offer us? Check in next week!